N-Acetyl-L-alaninol
* Please be kindly noted products are not for therapeutic use. We do not sell to patients.

| Category | Others |
| Catalog number | BBF-05184 |
| CAS | 35593-62-5 |
| Molecular Weight | 117.15 |
| Molecular Formula | C5H11NO2 |
| Purity | >95% by HPLC |
Online Inquiry
Specification
| Related CAS | 145842-51-9 (D-configuration) |
| Synonyms | Acetamide, N-[(1S)-2-hydroxy-1-methylethyl]-; (S)-N-(1-hydroxypropan-2-yl)acetamide; N-[(S)-1-(Hydroxymethyl)ethyl]acetamide |
| Storage | Store at -20°C |
| IUPAC Name | N-[(2S)-1-hydroxypropan-2-yl]acetamide |
| Canonical SMILES | CC(CO)NC(=O)C |
| InChI | InChI=1S/C5H11NO2/c1-4(3-7)6-5(2)8/h4,7H,3H2,1-2H3,(H,6,8)/t4-/m0/s1 |
| InChI Key | LFVBTAFBWUVUHV-BYPYZUCNSA-N |
Properties
| Boiling Point | 304.7±25.0°C at 760 mmHg |
| Density | 1.0±0.1 g/cm3 |
Reference Reading
1. Amide Spectral Fingerprints are Hydrogen Bonding-Mediated
Sara Gómez, Cettina Bottari, Franco Egidi, Tommaso Giovannini, Barbara Rossi, Chiara Cappelli J Phys Chem Lett. 2022 Jul 7;13(26):6200-6207. doi: 10.1021/acs.jpclett.2c01277. Epub 2022 Jun 30.
The origin of the peculiar amide spectral features of proteins in aqueous solution is investigated, by exploiting a combined theoretical and experimental approach to study UV Resonance Raman (RR) spectra of peptide molecular models, namely N-acetylglycine-N-methylamide (NAGMA) and N-acetylalanine-N-methylamide (NALMA). UVRR spectra are recorded by tuning Synchrotron Radiation at several excitation wavelengths and modeled by using a recently developed multiscale protocol based on a polarizable QM/MM approach. Thanks to the unparalleled agreement between theory and experiment, we demonstrate that specific hydrogen bond interactions, which dominate hydration dynamics around these solutes, play a crucial role in the selective enhancement of amide signals. These results further argue the capability of vibrational spectroscopy methods as valuable tools for refined structural analysis of peptides and proteins in aqueous solution.
2. Selective 1H-14N Distance Measurements by 14N Overtone Solid-State NMR Spectroscopy at Fast MAS
Nghia Tuan Duong, Zhehong Gan, Yusuke Nishiyama Front Mol Biosci. 2021 Apr 8;8:645347. doi: 10.3389/fmolb.2021.645347. eCollection 2021.
Accurate distance measurements between proton and nitrogen can provide detailed information on the structures and dynamics of various molecules. The combination of broadband phase-modulated (PM) pulse and rotational-echo saturation-pulse double-resonance (RESPDOR) sequence at fast magic-angle spinning (MAS) has enabled the measurement of multiple 1H-14N distances with high accuracy. However, complications may arise when applying this sequence to systems with multiple inequivalent 14N nuclei, especially a single 1H sitting close to multiple 14N atoms. Due to its broadband characteristics, the PM pulse saturates all 14N atoms; hence, the single 1H simultaneously experiences the RESPDOR effect from multiple 1H-14N couplings. Consequently, no reliable H-N distances are obtained. To overcome the problem, selective 14N saturation is desired, but it is difficult because 14N is an integer quadrupolar nucleus. Alternatively, 14N overtone (OT) NMR spectroscopy can be employed owing to its narrow bandwidth for selectivity. Moreover, owing to the sole presence of two energy levels (m = ± 1), the 14N OT spin dynamics behaves similarly to that of spin-1/2. This allows the interchangeability between RESPDOR and rotational-echo double-resonance (REDOR) since their principles are the same except the degree of 14N OT population transfer; saturation for the former whereas inversion for the latter. As the ideal saturation/inversion is impractical due to the slow and orientation-dependent effective nutation of 14N OT, the working condition is usually an intermediate between REDOR and RESPDOR. The degree of 14N OT population transfer can be determined from the results of protons with short distances to 14N and then can be used to obtain long-distance determination of other protons to the same 14N site. Herein, we combine the 14N OT and REDOR/RESPDOR to explore the feasibility of selective 1H-14N distance measurements. Experimental demonstrations on simple biological compounds of L-tyrosine.HCl, N-acetyl-L-alanine, and L-alanyl-L-alanine were performed at 14.1 T and MAS frequency of 62.5 kHz. The former two consist of a single 14N site, whereas the latter consists of two 14N sites. The experimental optimizations and reliable fittings by the universal curves are described. The extracted 1H-14N distances by OT-REDOR are in good agreement with those determined by PM-RESPDOR and diffraction techniques.
3. Serum Metabolomic Signature Predicts Ovarian Response to Controlled Stimulation
Xin Mu, Mei-Li Pei, Feng Zhu, Juan Zi Shi, Peijun Liu Horm Metab Res. 2022 Sep;54(9):625-632. doi: 10.1055/a-1882-3967. Epub 2022 Jun 22.
In in vitro fertilization (IVF), it is meaningful to find novel biomarkers predicting ovarian response in advance. The aim of the study was to identify serum metabolomics predicting ovarian response after controlled ovarian stimulation (COS). Blood samples collected at the start of pituitary downregulation and on the fifth day after COS using Liquid chromatography-tandem mass spectrometry (LC-MS/MS) methods were analyzed to quantify metabolites. Demographic data were calculated with SPSS version 22.0 software. Multivariate statistics were used to analyze metabolomics dataset. A receiver operating characteristic (ROC) curve was used to evaluate the diagnostic model. Analyses revealed 50 different metabolomics between the pre- and post-COS groups. Compared with baseline, amino acids increased significantly following COS. At baseline, acetylglycine was more abundant in FOI<1 group, while glycine and lipids increased in FOI≥1 group. After COS, glycine, N-acetyl-L-alanine, D-alanine, and 2-aminomuconic acid were higher in those with FOI≥1, but L-glutamine was abundant in FOI<1. ROC curves indicated that combination of glycine, acetylglycine, and lipids predicts different responses to COS (AUC=0.866). Serum metabolism might reflect the response to ovarian stimulation. Higher glycine and PC may be a good predictor for response to COS.
Recommended Products
| BBF-00764 | Cerebroside C | Inquiry |
| BBF-01826 | Deoxymannojirimycin | Inquiry |
| BBF-01693 | Doxorubicin EP Impurity A (Daunorubicin) | Inquiry |
| BBF-03754 | Castanospermine | Inquiry |
| BBF-02642 | Lactonamycin | Inquiry |
| BBF-03755 | Actinomycin D | Inquiry |
Bio Calculators
* Our calculator is based on the following equation:
Concentration (start) x Volume (start) = Concentration (final) x Volume (final)
It is commonly abbreviated as: C1V1 = C2V2
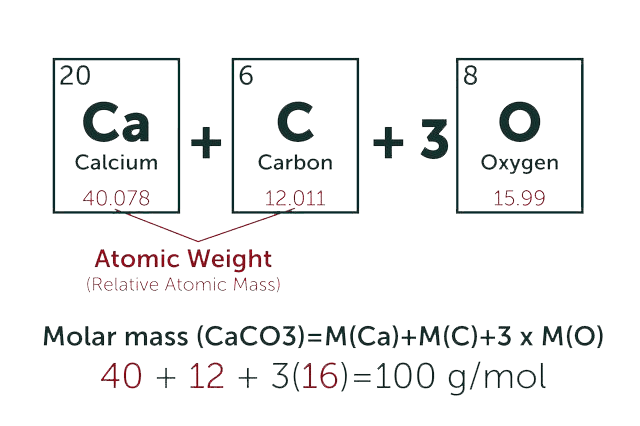
* Total Molecular Weight:
g/mol
Tip: Chemical formula is case sensitive. C22H30N4O √ c22h30n40 ╳